So for all those loyal subscribers out there (hey mum!) you might wonder what the hell happened to my constant stream of insightful, relevant and handsome blog posts.
Well, I’d have to say you’re thinking about me a little too much – I’d suggest committing yourself to a hobby like me.
Perhaps regular blogging?
Surviving Nay Pyi Taw
In truth, Myanmar has also kept me pretty busy. That is until recently, when I was handed a steaming pile of free time as a result of moving to the traffic-free social desert that is Nay Pi Taw, Myanmar.
And how would any sane person use this time?
Well you’d be best to ask them. As for me, I decided to enroll in a six month dose of data science administered by John Hopkins University (JHU).
So consider this your warning, as that’s where this blog is going.
But to make escape easy here’s a link to YouTube trending and for those of you with a short attention span I’ve also created a TLDR (short) version at the end.

Rationalizing Self-Harm
That’s right. I know what you’re thinking – why would anyone volunteer to learn about data?!
Well you see, I was a curious child and time has turned me into a curious man-child, as a result, a surprising amount of my career has been defined by being asked difficult questions by difficult people.
While this has meant that I’ve been able to do a lot of interesting work, it has also made it increasingly apparent that many interesting problems go unsolved because people aren’t sure how to approach data.

Which is where this niche blog post begins, as it was from this observation that I decided it would makes sense to arm myself with a statistical tool that:
- Is capable – allowing it to be applied to a range of data-related geekery;
- Is portable and cheap – allowing it to be easily adopted regardless of an organization’s size and financial resources;
- Can work with data in a variety of formats – making it easier to transport analysis to/from a wide variety of sources; and
- Is useful across disciplines – making it suited across fields and in multidisciplinary teams/organizations.
In essence, I was looking for the ‘spork’ of data science software. Which is apt because like a spork, R can do a lot of things but is a little awkward and unwieldy.
However, unlike a spork R is popular.
So popular, that it’s a global standard in the data world. But not so popular that you’re going to get invited to more parties :(.
Which brings me to another disadvantage of R – it’s known for being a little unwieldy: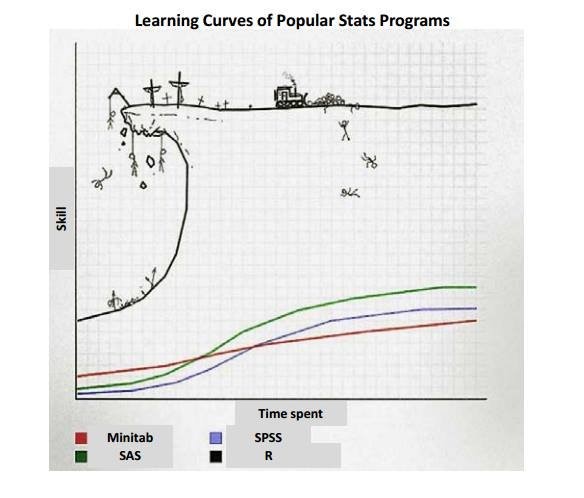 Basic Analysis of Workshop Data
Don’t get me wrong, I’m not claiming your learning experience will see as many deaths as the figure above. But it’s best to go in expecting that learning R is more like walking on lego than cake.
Which is why I chose to do JHU’s Data Science specialization. As if I’m going to be walking on lego I’d prefer to do it quickly and with more decorum than a monkey with a typewriter.
So, the choice was made and a high standard set: Don’t be a monkey.
An Overview
Now for those of you with a short attention span, remember I’ve include a short summary at the end of this post but in essence JHU’s Data Science specialization is made up of nine courses which can be roughly divided up into two main ‘flavors’:
- The basics of working with R – such as writing scripts, using GitHub, importing/exploring data, and generating statistics; and
- The actual reason we want to work with R – such as creating interactive visualizations on the web, creating catterplots, running regression models and encouraging your computer to become sentient via machine learning.
Once completing these nine courses students are then provided with the option to complete the final ‘Capstone’ course which is meant to provide an opportunity to apply your skills on a real-world problem.
setwd(“internet”)
So in the spirit of [insert closest holiday here] and to spoil the ending, let me just say that completing the specialization was worthwhile. It covers a range of useful topics, is delivered by world-class lecturers and forces you to apply what you learn. The course also fulfilled my embarrassing desire to apply some science to data, which is essentially the only way to learn R, via R-ing (?).
For instance, the quizzes and programming assignments give you messy data, complicated problems and ask you to use R to present analysis in a digestible format. As a result, if you legitimately complete the courses you’ll come out having learned a lot.
Although it’s hard to compare online courses with those offered by a traditional university, I’d probably say that JHU’s Data Science specialization might be something close to a four-course graduate certificate. This is based both on the level it’s pitched at, the workload and the fact the entire specialization took me a little over six months with a background in statistics (although your experience may vary).
It’s also relatively inexpensive when compared with the more traditional alternatives at a little under $300 USD or around five percent of the cost of a comparable program.
This is Fine
Yet all is not well in the world of the JHU Data Science series.

You see, although I’m glad I did the course, it was not without shortcomings.
Firstly, I was originally attracted to the course as it appeared to cover an impressive array of topics. Yet courses were only a month long which meant subjects often had to sacrifice depth and/or place unrealistic learning outcomes on the students. Unfortunately, the JHU Data Science Specialization often chose both by skimming through essential topics then grading students on them.
Take the Statistical Inference course, which tries to quickly illustrate how to respect the rules of the God of numbers and explain why we care about infinity, even when we’re unlikely to get there anytime soon. While interesting, a frolic through discussions in the message boards made it pretty clear that the ‘vomiting equations onto a PowerPoint presentation’ wasn’t a particularly effective teaching approach.
A similar story could also be told of the regression course which gently introduces learners to the concept of linear regression before abruptly lobbing a grenade of generalized-linear models, probits, logits and something to do with a hockey stick.
This I found to be particularly unfortunate as regression analysis is a useful tool for so many types of analysis. It’s also conceptually useful, as it reminds budding statisticians that there isn’t usually a ‘silver bullet’ explanation for what’s driving something and usually your conclusion relies as heavily on statistical assumptions as it does the data.
More generally, when you’re applying statistics in the real-world, abstract concepts aren’t particularly helpful until you’ve internalized them – something I suspect for most mortals would require more time than the course allowed.
The Sound of One-Hand Clapping
Of course whether the course did include other mortals is an open question, with discussion boards mainly filled with generic ‘please mark my assignment’ requests from past sessions of the course. Although this might have been a natural consequence of the field not attracting social superstars (myself excluded of course…), even for a mixed-gender game of dungeons and dragons human-to-human interaction was low.
Relative to other online courses I’ve done, this led to a much poorer learning experience. This was both because you weren’t able to rely on the hive-mind when you had a problem and as it meant you didn’t get the benefit of understanding how others are applying what they learn outside of the course.
Assessment Structure
Given online courses can have thousands of students, quizzes and ‘peer-graded’ assignments tend to be the backbone of the assessment structure in the world of MOOCs. In JHU’s case, online quizzes were typically run each week while peer-grading (where students mark each other) was used for major projects.
For those unfamiliar with ‘peer-grading’ basically you submit your assignment, mark five of your peers and receive a grade based on the most common score given by five students that have marked your submission. Generally, it can work quite well and I’m a big fan – you see how others have approached a problem, get a sense of where you stand relative to your peers and hopefully receive useful feedback to improve your work.
Alas, in the JHU specialization it wasn’t always done well, with much of the feedback I received being minimal. Although I suspect this is in part due to me having attained perfection, I’d also say that this is a result of:
- The courses being run within a short timeframe – discouraging students from assigning more time and thought to marking;
- The marking criteria sometimes not providing much scope to differentiate adequate assignments from the exceptional;
- The age of the course meaning that the internet is now awash with past assignments, making plagiarism easier for the lazy; and
- The system not encouraging quality feedback – such as by rewarding those that give good feedback by assigning them markers that are likely to give good feedback in return.
The Capstone
Finally, there’s the final project or ‘Capstone’ which was described as “a project drawn from real-world problems and will be conducted with industry, government, and academic partners.”
I of course assume that was a typo as a more apt description was “A project randomly drawn from a real-world problem largely unsuited to the R language, principally unrelated to the other courses in the specialization and unlikely to be useful at any point in the near future.’
In the words of one reviewer “Of all the offerings in the specialization, this one felt like it was thrown together in less than hour.” And while this might seem unfair, this thought definitely crossed my mind as I was cobbling together an interactive predictive text application that will unlikely be useful to anyone unless they’re looking to generate gibberish.
A disappointing end given the effort that was required to get there.
Two-parts contentment. One part complaining.
But again, the specialization wasn’t all bad. Far from it.
For instance, while the regression modelling, machine learning and statistical inference courses could definitely be better structured and longer, my experience is that teaching these topics is harder than learning them. I also imagine this is all the more difficult when you’re teaching a classroom of 100+ whiny nerds.
I’d also say that some of the potentially boring topics were well done.
For instance, although both ‘Getting and Cleaning Data’ and ‘Exploratory Data Analysis’ could have been more tightly focused, I came out of both courses with a much better appreciation of what’s possible. The courses also made me remember why I was doing the course in the first place as it demonstrated why R is so useful.
Finally, while the final lecture for ‘Reproducible Research’ appeared to be from a different subject altogether, the course was one my favorites. This is for one as it explained what the hell the ‘knit’ button in R Studio does, but also as it covered the how/why of making research reproducible in R – something that is rarely achieved in economics.
While at first glance this might appear as a solely academic issue, as an applied economist I can see many times during my career that the tools would have been tremendously useful for naturally building in reproducibility and transparency into my team’s work as it:
- Makes collaboration easier;
- Allows the analysis to be quickly repeated with new assumptions and/or data; and
- It provides a more reliable way of recording what was done for archival purposes.
While this might still sound somewhat abstract, in the world of economic policy it’s not uncommon to be asked to repeat several iterations of politically sensitive analysis in a short-time frame.
Get it right and you can keep your job.
Make a mistake and you might just make history.
Summary()
So what would I say to someone thinking of making the arduous journey to complete the specialization?
Well, firstly although parts of the specialization were disappointing, it’s a great overall program and I’ve learned much of what I was hoping to. I understand R, have a better sense for when meaningful insights can be gained from data outside of economics and have a better feel for how analysis can be made interactive and accessible to a wider audience.
The course is also a bargain, costing less than five percent of the tuition of a comparable 6-month course at University.
Of course, it also seems that the JHU Data Science specialization has been largely abandoned, with the world of online data science courses becoming more competitive in the meantime, with Harvard, Berkley, Microsoft and the University of Michigan all providing their own data science specializations both in R and Python.
As such, while I’m glad I endured through the 10-course JHU data science extravaganza, if I was going to do it now I’d be inclined to go with one of the competitors.
This is both because I would place my bets on the competing options having learned from the strengths of the JHU course, while dropping its weaknesses. But also, because unless JHU updates their specialization its prestige and its power to signal the recipient’s determination will diminish over time.
Of course, in the world of online learning it doesn’t have to be all or nothing – pick one, pick two or decide to prioritize your social life by picking none of them, whatever you choose it’s a great time to conquer your fear of data.
I’m looking at you Darren.
TLDR Version:
Good course, glad I did it but would recommend checking out the alternatives from Harvard, Berkley, Microsoft and the University of Michigan.
The Good:
- Getting and Cleaning Data – Learn how to get data into R and make it useful for analysis.
- Exploratory Data Analysis – Make graphs with different plotting systems and be given a brief and unsatisfying crash course on PCA.
- Reproducible Research – Learn what the ‘create R markdown’ document option means in Rstudio and the philosophy of reproducible research.
- Regression Models – Be gently introduced to linear regression through a series of intuitive lectures before being rushed through the more complicated logistic and poison regression in the final week.
- Practical Machine Learning – Learn the basics of machine learning models.
- Developing Data Products – Briefly learn about some of the coolest parts of R such as creating interactive dashboards for the web.
The Bad
- R Programming – Learn the essentials of R and lose sleep while writing functions needed to complete the assignments. Bonus: Watch a large proportion of the class drop out.
- Statistical Inference – Be quickly rushed through essential statistical concepts with insufficient explanation. Bonus: Watch a large proportion of the class drop out.
- Capstone Project – Be given minimal instructions about solving a problem which will likely be useful for 0.5 per cent of R users during their career.
The Neutral
- The Data Scientist’s Toolbox – Install R, Rstudio and set up a github account.